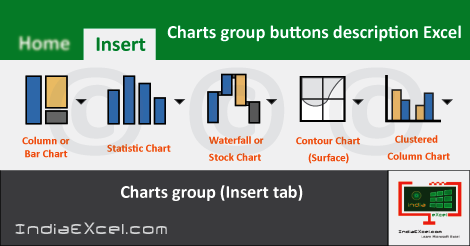
Charts group buttons commands of Insert Tab MS Excel
Charts group buttons Insert Tab Excel 2016
See Previous Post: Insert Tab Add-ins group buttons tools Microsoft Excel 2016
In the first place, after the discussion on first three groups, the Charts group is the fourth group. Above all, the Tables group, Illustrations group and the Add-ins group are the first three groups. So, the Insert Tab ribbon has the Charts group in Microsoft Excel.
Also, the Charts group offer variety of charts types in Excel. Specifically, different types of charting capabilities helps users to project complex data in simple pictorial ways.
Firstly, the Recommended Charts, Insert Column or Bar Chart and the Insert Line or Area Chart etc; are the charts. Secondly, the Insert Pie or Doughut Chart, Insert Heirarchy Chart, Insert Statistic Chart, etc. are rest of the charts.
Charts group tools Insert Tab MS Excel – continued
Thirdly, are the Insert Scatter (X, Y) or Bubble Chart and the Insert Waterfall or b etc. Fourthly, the Insert Combo Chart, Insert Surface or Radar Chart and PivotChart also available charts types. Particularly, the PivotChart and the PivotTable options are present within PivotChart drop down menu button.
Especially, most of the chart buttons have Drop down List Menu. Further, the buttons with menu list extends to more charts options. Generally, we show the comparison between data in the charts. Also, projection of the growth of a company, monthly or annually is through help of the charts.
Even more, the 2-D Column charts, 3-D Column charts, 2-D Bar charts and the 3-D Bar charts etc; are some of the two & three dimensional charts. In addition, are the 2-D Line charts, 3-D Line charts and the 2-D Area charts etc.
Moreover, the charts are the 3-D Area charts, 2-D Pie charts and the 3-D Pie charts etc. Also, are the Treemap charts and the Sunburst charts etc. Additionaly, the Histogram charts, the Box charts and the Whisker charts are the two dimensional charts.
The Charts group also has a Tiny Small Arrow on the Right Hand Corner. Especially relevant, it is the Dialog Box Launcher button. And, the name of this button is “See All Charts“.
So, on clicking this button, the Insert button dialog pop up window box shows up. And, this box contains two tabs i.e. the Recommened Charts and the All Charts tabs. But, the See All Charts button works when users have some data in worksheet. This data is especially for the type of chart that users want to create.
Charts group commands Microsoft Excel 2016
- Recommended Charts
- Insert Column or Bar Chart
- 2-D Column
- 3-D Column
- 2-D Bar
- 3-D Bar
- More Column Charts
- Insert Line or Area Chart
- 2-D Line
- 3-D Line
- 2-D Area
- 3-D Area
- More Line Charts
- Insert Pie or Doughut Chart
- 2-D Pie
- 3-D Pie
- Doughnut
- More Pie Charts
- Insert Heirarchy Chart
- Treemap
- Sunburst
- More Heirarchy Charts
- Insert Statistic Chart
- Histogram
- Box and Whisker
- More Statistical Charts
- Insert Scatter (X, Y) or Bubble Chart
- Scatter
- Bubble
- More Scatter Charts
- Insert Waterfall or Stock Chart
- Waterfall
- Stock
- More Stock Charts
- Insert Combo Chart
- Combo
- Create Custom Combo Chart
- Insert Surface or Radar Chart
- Surface
- Radar
- More Charts
- PivotChart
- Pivot-Chart
- PivotChart & PivotTable
See Next Post: Tours Sparklines Filters groups buttons Insert Tab MS Excel 2016
Terms related to this Post:
Multi category chart excel
Excel chart group by column value
Grouped bar chart excel
Group axis labels in excel
Excel chart subcategories
Excel bar chart with multiple categories
Stacked bar chart excel
Two level axis labels excel

Stay Connected
Connect with us on the following social media platforms.