Charts buttons description Charts group Microsoft Excel 2016
Charts buttons overview of Charts group Excel
See Previous Post: Insert SmartArt Graphic buttons categories overview MS Excel 2016
First of all, elaboration about on the Charts buttons of the Charts group had been done. Notably, an overview was provided, while we discussed about this group, in one of the post. Now in this post, we’re going to know even more once again.
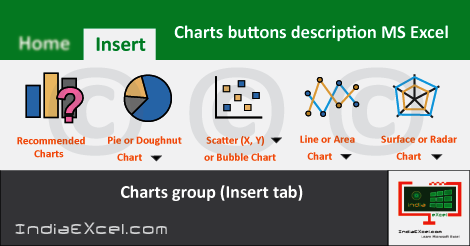
The Insert tab has the Charts group. Additionally, the Charts group contains ten Charts buttons. Out of which, nine of them have Drop down Menus. Also, these are divided into categories. The Charts group have the Recommended Charts, Column or Bar Chart and Line or Area Chart etc.
Additionally, the Pie or Doughnut Chart, Insert Hierarchy Chart and the Statistic Chart etc; are part of this group. Also, the Scatter (X, Y) or Bubble Chart and the Waterfall or Stock Chart are available in this group. Lastly, the Combo Chart, Surface or Radar Chart and the PivotChart are the remaining ones.
Charts buttons tools of Charts group MS Excel
Firstly, the Recommended Charts helps with a tip, regarding chart types to choose from and is best for the data. Secondly, the Insert Column has Clustered Column, 3D Stacked Column, Clustered bar and 3D Stacked bar etc. Thirdly, the Line with Markers, 3D Line, Area and 3D 100% Stacked Area etc; are part of the Line Chart.
Next, the Pie Chart has the Bar of Pie, 3D Pie and Doughnut Chart etc. Further, the Treemap Chart and Sunburst Chart are to be found in the Hierarchy Chart.
Furthermore, the Statistic Chart has the Histogram Chart and Box & Whisker Chart etc. Even more, the Scatter with Smooth Lines & Markers & 3D Bubble Chart etc. are part of the Scatter (X, Y) Chart.
Moreover, the Waterfall Chart has the High-Low-Close Chart and Volume-Open-High-Low-Close Chart etc. Finally, the Combo Chart comprises of Clustered Column – Line and Stacked Area – Clustered Column etc.
And the 3D Surface Chart, Wireframe Contour Chart and Filled Radar Chart etc; are part of the Surface or Radar Chart. Lastly, the PivotChart contains the PivotChart & PivotTable.
See Next Post: Financial button functions Function Library group MS Excel 2016

Stay Connected
Connect with us on the following social media platforms.